Collecting and Reporting Data
Case Study 8: Collecting and Reporting Statewide Student Savings Estimates in Oregon
Amy Hofer
Background
Open Oregon Educational Resources promotes textbook affordability for community college and university students, and facilitates widespread adoption of open, low-cost, high-quality materials. I’m the Statewide Open Education Program Director for Oregon’s public higher education institutions, which comprise 17 community colleges and 7 universities that are not in a system. This means that our 24 community colleges and universities coordinate with the statewide program on an opt-in basis. Each institution has at least one OER adoption, a designated OER point person that I communicate with regularly, and participates in professional development opportunities. However, each institution also has its own unique culture and is in a different place with textbook affordability implementation, which adds complexity when it comes to collecting data about OER impact on each campus.
Open Oregon Educational Resources provides impact reporting on the effectiveness of the statewide OER program in order to show that we are effectively using the public dollars that fund the program. In my case, I’m accountable to the statewide Higher Education Coordinating Commission and the state legislature. They want to know about student savings that result from statewide investment in textbook affordability at least once a year, so that’s the kind of data that I usually focus on gathering and reporting, and that’s what I’ll write about here.
The Messiness of Data Collection and Reporting
Open Oregon Educational Resources reports on several different policies and professional development programs that relate directly to student savings, and each one is assessed differently. Generally speaking, student savings reporting is simpler when the assessment is centralized and uses consistent metrics to calculate impact. It gets more complex when the assessment is decentralized and includes multiple methods.
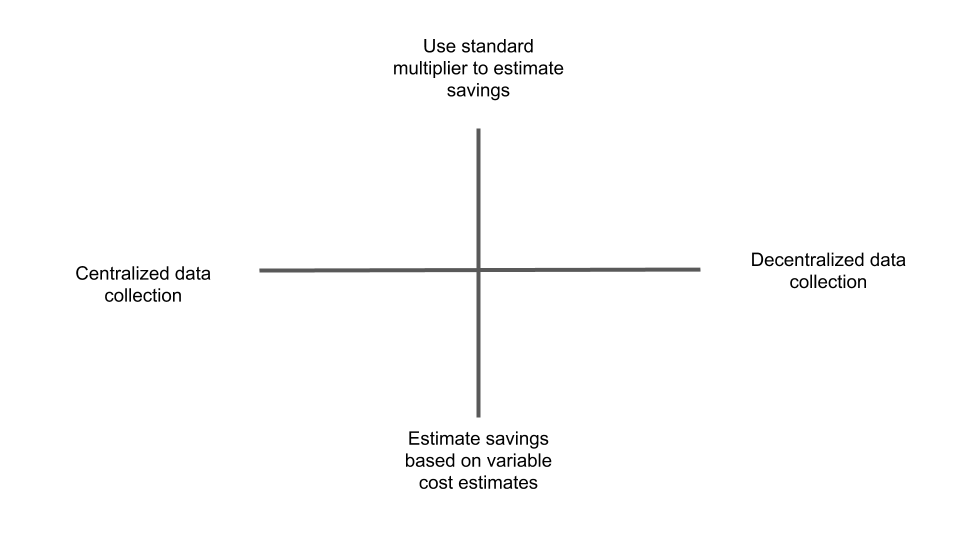
Here’s an illustration of what I mean. Figure 1 below represents four quadrants where your data collection and reporting might fall based on two foundational characteristics of the program. Plot your program on the X axis according to how centralized your data collection is, and use the Y axis to show how much your savings multiplier varies per course in your program. While this model borrows loosely from math concepts in order to make a visual representation, it doesn’t map onto ideas about positive/negative, values, etc. In other words, pulling your data into a more centralized system might not make its management easier, and standardizing your calculations might not make your results better. Rather, the model may be helpful in clarifying how the tools and methods you use will enable you to tell an effective story about your program. The narrative accompanying your data provides context where you can explain the methodological decisions you made and/or highlight the impact of your program.
In some ways, the least complex type of data that I gather is for the Open Education Network (OEN) OER Review Workshops, because the workshops are run centrally, at the statewide program level, and use a standard multiplier of $100 per student, per course, to estimate student savings if faculty participants go on to adopt OER. A dot representing this program would go in the upper left corner of the graphic.
I do a somewhat more complex assessment to estimate student savings resulting from the different grant cohorts that have run since 2015. While this program is run centrally, at the statewide program level, the student savings calculation is based on the actual cost of the previously assigned textbook, new, at the campus store. When faculty apply for course redesign grants, they record the cost of their current textbook. That’s the number that I use to multiply by enrollment when I report on grant program impact. A dot representing this program would go in the lower left corner of the graphic.
In reality though, these explanations are simplifications. For example, returning to the example of estimating savings resulting from OEN’s OER Review Workshops, when it was time to report on these savings in 2019, Open Oregon Educational Resources beta-tested the OEN’s Data Dashboard. This different level of centralization changes the model – either by making the X axis extend further to the left, or by moving the dot for the program further to the right. Complicating the example of the statewide OER grant program, lots of faculty don’t enter a single number when I ask the cost of their current textbook. Instead, they’ll enter a price range, list different prices at the different institutions on the proposal, state $0 if they already use no-cost course materials, or enter $100 as an acceptable estimate if it’s a brand-new course or they don’t know the answer. In other words, different grants within the cohort might need separate dots on different parts of the Y axis, or the program might be represented by a blob.
That caveat gives me a running start to describe an even more complex research project: estimating student savings, or cost avoidance, represented by the no-cost/low-cost schedule designation mandated by Oregon’s HB 2871. In this case, I reach out to all 24 of my point people at Oregon’s community colleges and universities and ask them to develop a method to calculate this, if they haven’t already, so that they can share data with me. I aggregate and report the total. This approach acknowledges that any student savings number will be an estimate, while prioritizing local needs and expertise regarding campus-level decisions about data. The resulting report includes a range of different methods covering both of the right-hand quadrants in the graphic.
Figure 2 below shows the simple and messy ways to think about data collection and reporting.
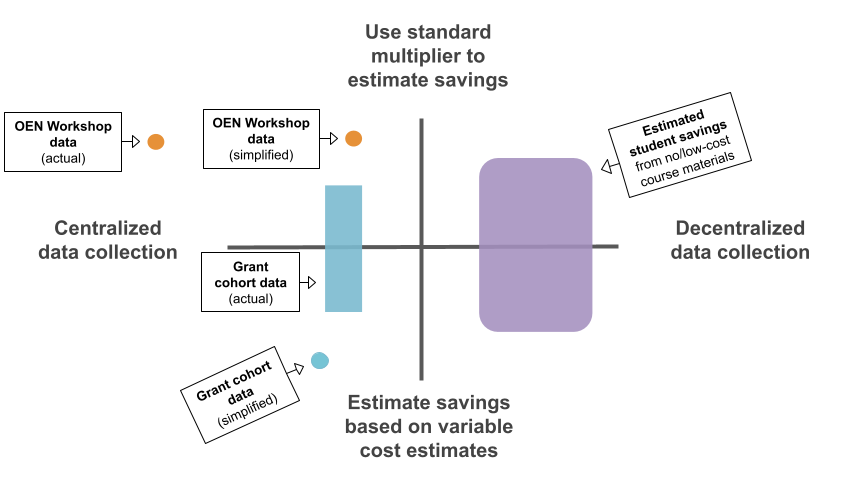
What the messy model shows is that all student savings estimates are the result of decisions you made, which you might explain in more or less detail depending on your audience. There are many valid ways to arrive at an estimate, and they can coexist even when you’re reporting on a single program. Yet the big-picture takeaway remains the same: saving money has a big impact on students, regardless of the method used to calculate the amount.
Scaling Past Spreadsheets
Open Oregon Educational Resources runs many different professional development programs that result in redesigning courses with OER, and are therefore associated with student savings. Since proposals and registrations usually start with a Google form, I already have a spreadsheet to track participants as each program begins, and then I can continue collecting student savings data in that same spreadsheet. Using multiple spreadsheets makes it simple to keep program participants and data separate among the current programs that are running at any moment (consult Chapter 22 for more considerations on collecting and reporting student savings with spreadsheets).
However, as time has passed, the “multiple-spreadsheets approach” has started to be a “too-many-spreadsheets problem.” Gathering historical data for past programs means opening many files and then copy/pasting calculations into a cumulative spreadsheet. I also don’t have a way of easily understanding impact when faculty participate with Open Oregon Educational Resources across professional development programs. For example, they can begin by writing a review of an open textbook, then receive a grant to redesign their course when they adopt the book that they reviewed, and then receive a follow-up grant to create ancillary materials for that same course. At this scale, a relational database will handle the data better.
I identify as an experiential learner, my tech skills are only okay, and I don’t have access to institutional support for the tools I use. Here are some of the options that I explored given these constraints:
- Retrospective data collection spreadsheet
- Tableau
- MS Access
- MySQL
- Airtable
- LibreOffice Base
I looked into these alternatives by doing just enough experimentation to figure out that I didn’t have the time or setup to use most of these options effectively. For now, and partly through the process of elimination, I’m using a pro Airtable account because Airtable looks a lot like spreadsheet software, which I’m already very comfortable with. You don’t have to run Windows to use it, you don’t need to do any programming, and it’s in the cloud. Despite the easy entry, though, I pretty quickly got stuck on advanced functions between linked tables, so I reached out to a local nonprofit I’ve volunteered with that uses Airtable and hired one of their employees as a contractor. We’re still working on the best way to enter new data and documentation of how to get all the data back out for reporting.
Community support
Part of my research process involved asking different communities for help. I sent a message to three OER listservs and learned that a lot of other people were running into similar questions and thinking about the same options. I called a friend who is a retired database manager to see whether she wanted to come out of retirement for one freelance job. I also talked with the OEN Data Dashboard development team about whether their tool could meet my program’s needs.
It has been illuminating to talk to all the different people that I’ve dragged into my problem. My open education colleagues instantly understand what data I collect and how I want to report on it, but have less expertise with database tools. The database experts that I’ve talked with are leaps and bounds ahead of me in terms of the potential for a design, but need me to break down definitions for programs, projects, course numbers, cohorts, and all the other terms I use to talk about how I interact with faculty.
As of this writing, I’ve identified three-ish options that are emerging in the Open Ed field for solving the “too-many-spreadsheets problem” with databases. As I mentioned above, I’m testing an Airtable database. The OEN’s Data Dashboard is a promising membership-based solution that also may lead to the creation of a multi-institutional data set. Third, the Virtual Library of Virginia (VIVA) is developing a custom MySQL database to track their OER program data.
Accepting Uncertainty
Looking back at spreadsheets from the mists of time makes me realize how much information about Oregon’s OER program I’ve collected while still learning about what data – and what data structure – I need in order to do good reporting. Applying what I’ve learned will entail a lot of cleanup as I’m transferring data currently stored in old spreadsheets and my unreliable memory into a new database. Tackling this problem will make Oregon’s program more resilient because the data will be easier for other people to work with. But changing how the data is stored doesn’t simplify decisions I make about how and what to report on in order to tell an effective story about the student savings impact of Oregon’s OER program.
For other program managers approaching the work of tracking and reporting data on their program’s impact, I have two potential recommendations based on what I’ve learned.
Recommendation 1: Collect data about your program for a couple of years in a way that works for your needs and capacity. Then step back and figure out whether you need to change your model based on what you know now about your program. Maybe your organically-grown system will keep working for you as-is or with minor changes. If it has grown to the point where you need to scale up from spreadsheets to a database…
Recommendation 2: There are several sharable solutions that are almost ready to be adopted or adapted at the time that I’m writing this. That means that you may have the option of establishing a system in advance of collecting your data, or changing your approach with the benefit of existing tools.
I’m excited by the possibilities of having my data stored in a relational database and I think it’s a scalable solution, but more than that, I hope that other program managers reading this case will feel validated in trying out different options without knowing the outcome in advance. My data collection experiences so far have been messy, follow-your-nose processes that have nonetheless enabled me to keep the program moving towards our vision that high quality, low-cost learning materials will be thoughtfully integrated into teaching and learning in Oregon’s higher ed institutions. Sharing data about student savings along the way creates opportunities to celebrate and thank the faculty, point people, and other OER champions whose work makes the impact possible.
Additional Resources
Methods
- Estimating student savings from no-cost/low-cost course materials
- Support for a Local Approach to Statewide OER Data Collection
- One Ton of OER Impact Data
- Too Many Spreadsheets? Relational Databases for Open Ed Program Data Collection and Reporting
